Market seasonality almanac · v2026.07.15
Koyomi
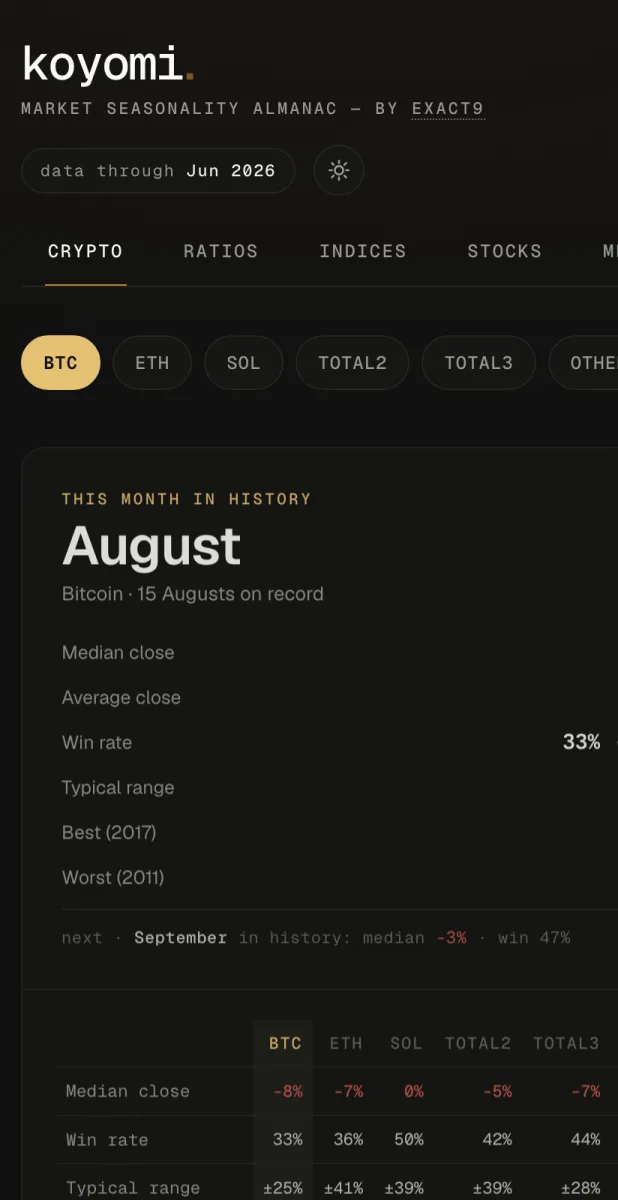
A market almanac built on decades of monthly data: which months historically close green, how wild each month tends to be, and where the current year sits in its cycle. Covers Bitcoin and the crypto market, global stock indices, metals and currencies — plus how the month in progress compares to every version of it on record. Educational only: history is context, not a promise.
Put it on your home screen
There is no App Store listing and no Google Play listing. The browser installs it, which takes about ten seconds and costs nothing.
iPhone & iPad
Safari — Chrome on iOS cannot install web apps. Tap the Share button, scroll to Add to Home Screen, then Add.
Android
Chrome — tap the ⋮ menu at the top right, then Install app (Add to Home screen on older versions).
Desktop
Chrome or Edge — click the install icon at the right of the address bar. The app gets its own window, without browser chrome.
What changed
- 15 July 2026releaseReorganised as a pure almanac: you land on this month in history, not a dashboard.
- 15 July 2026noteFive markets — crypto, ratios, indices (11 global, including BET), metals and FX. Crypto from 2011, the S&P 500 from 1950.
- 15 July 2026notePresidential cycle for indices, halving cycle for crypto — each phase card computes its own stats from the asset you are viewing.
Something should be better?
Write to hello@exact9.com — it goes into the queue for the next release. No account needed.